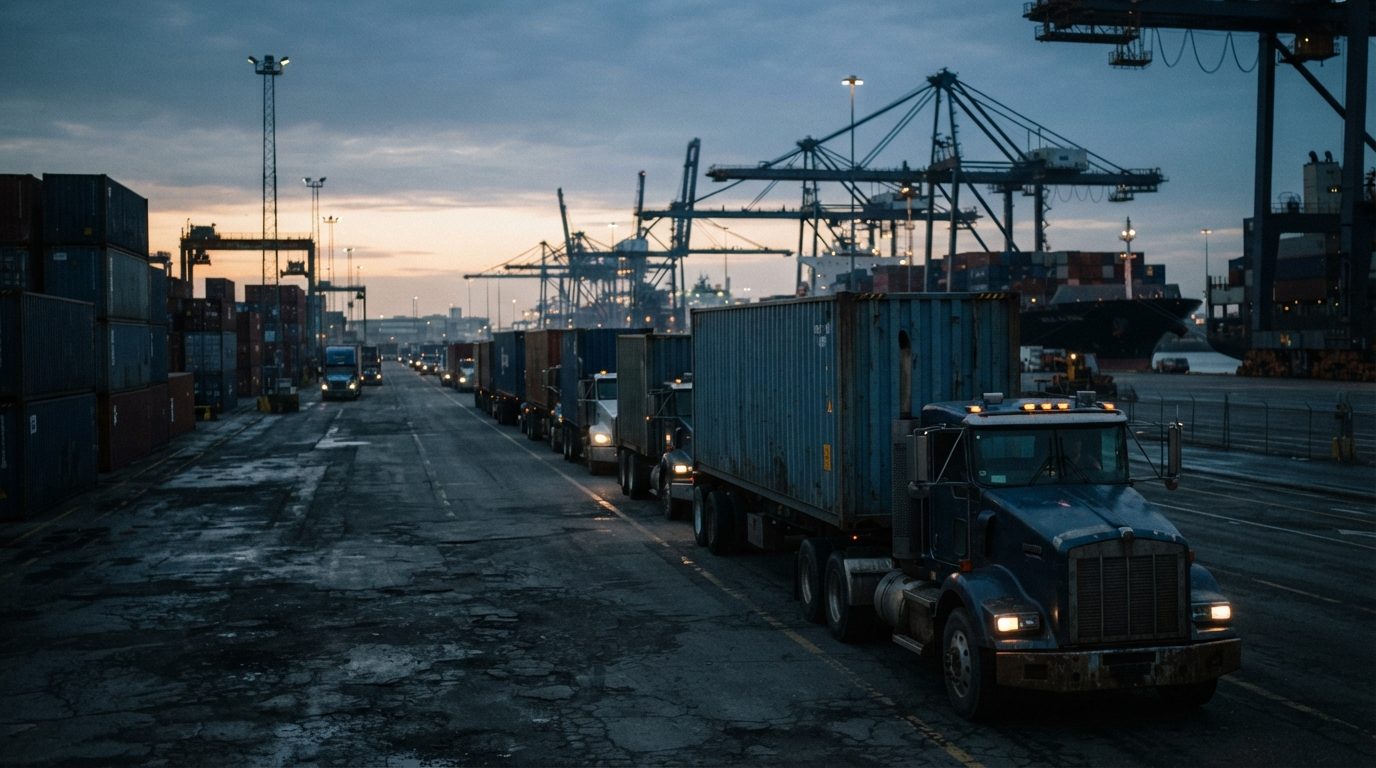
Real-Time Fleet Compliance Monitoring for a Drayage Carrier
AI AutomationIn collaboration with Visionary Automate

Real-Time Fleet Compliance Monitoring for a Drayage Carrier.

A container drayage carrier running roughly 100 CDL drivers out of a West Coast port had no standard way to tell a real terminal wait from a padded one. We built five monitoring engines on top of the existing GPS telematics feed. Delivered in collaboration with Visionary Automate, a systems-integration partner of Zealous Digital Solutions.

GPS telematicsSQLReal-time alertingBI dashboardWorkflow automation
Scroll to explore
$427K to $562K

Modeled annual value

$240K/yr (est.)

Modeled idle recovery

70% (est.)

Modeled review time cut

Real-Time Fleet Compliance Monitoring for a Drayage Carrier
(How We Built It)
01

Challenge

Drivers could inflate terminal wait times, sit on the clock after unloading, or run personal errands on duty, and nobody could prove it. Management read raw GPS logs by hand with no shared definition of what counted as an exception.

02

Approach

Built five real-time monitoring engines against the telematics feed, each with its own configurable threshold, plus instant chat alerts, exception-only reporting, driver scorecards and a SQL evidence trail behind every flag.

03

Results

Idle time is now flagged as it happens rather than argued about a week later, and every flag carries a timestamped record. The dollar figures on this page are modeled from the carrier's own rates and volumes, not audited outcomes.

Real-Time Fleet Compliance Monitoring for a Drayage Carrier

The full story behind Real-Time Fleet Compliance Monitoring for a Drayage Carrier.

(Case Study)
01

The situation

A container drayage carrier operating out of a West Coast port ran a fleet of roughly 100 CDL drivers. Their visibility problem was not a lack of data. GPS was already on every tractor. The problem was that nobody had ever written down what the data was supposed to mean.

Three patterns kept repeating. Drivers reported terminal wait times longer than the tracker showed. Drivers stayed on the clock after a load was off. Drivers made stops that had nothing to do with the run. None of this was provable in a way that survived a conversation with a dispatcher or a union rep, because the only record was a raw log somebody had to scroll through.

Management was spending around thirty hours a week reading GPS and camera footage by hand. That work produced arguments, not decisions. California CDL drivers run $32 to $35 an hour. One or two wasted hours per driver per day, across a hundred drivers, is a number well past $400,000 a year. The carrier could feel the leak and could not point at it.

Delivered in collaboration with Visionary Automate, a systems-integration partner of Zealous Digital Solutions.

02

What was built

Five monitoring engines run continuously against the live telematics feed. Each one watches a distinct behaviour: idle inside a terminal, idle in the yard, idle at a warehouse, movement after a confirmed unload, and idle at a location that matches no known stop on the run.

Every engine has its own threshold, and every threshold is configurable per customer, per lane and per site. That mattered more than the detection logic. A twenty-minute wait at one terminal is normal and at another it is a red flag, so a single global rule would have produced noise that operations would learn to ignore inside a week.

When an engine trips, two things happen at once. The driver gets a chat message while the truck is still sitting there, and the dispatcher gets the same alert with the location and the elapsed clock. Reports are exception-only, so nobody opens a document listing 100 drivers who did nothing wrong.

On top of that sits a driver scorecard with trends over time, a BI dashboard with daily, weekly and monthly views, and a SQL evidence trail that ties every flag to a timestamp and a coordinate. The evidence trail is the part that changed disciplinary conversations, because a flag is now a record rather than an opinion.

The engine logic and the evidence schema were specified and built jointly. Delivered in collaboration with Visionary Automate, a systems-integration partner of Zealous Digital Solutions.

03

How the ROI model was built

The value figures on this page come from a model built on the carrier's own rates and volumes. They are not audited books. Here is what the model assumes:

• 100 CDL drivers valued at $32 per hour, per Salary.com state rate data • Supervisor and management time valued at $28 per hour • 1.2 hours of flagged idle per driver per day across 250 working days, or 30,000 hours a year • Only 25 percent of that flagged idle is treated as recoverable, not all of it • Around 30 hours a week of manual GPS and camera review, reduced by 70 percent • Roughly 15 hours a week of manual sorting and reporting, automated • Inflated detention charges running $10,000 to $20,000 a month before the build • Disciplinary disputes costing $15,000 to $30,000 a year, now backed by GPS records

Those inputs produce a modeled annual benefit of $427,000 to $562,000, and the model suggests payback inside two weeks. For context on the ratio, IDC's 2024 benchmark puts average enterprise AI return at about $3.50 per dollar spent. Actual results depend on the client's baseline and adoption. These figures are modeled estimates, not measured client results.

04

What changed operationally

The first operational change was the end of the weekly log review. Exception-only reporting means a supervisor opens a list of events that need a decision instead of a log that needs interpretation.

The second change was in tone. An alert that arrives while the truck is still at the terminal reads as a nudge. The same information delivered five days later in a meeting reads as an accusation. Drivers responded to the live version differently, and dispatchers stopped having to relitigate last Tuesday.

The third change was in billing. Detention charges are now checked against a timestamped record at the moment they are claimed, so a disputed charge has a source of truth attached to it rather than two conflicting recollections.

Thresholds get tuned rather than argued about. When a terminal genuinely runs slow, the threshold for that terminal moves, and the change is visible to everyone. That is what keeps the alerts credible.

Threshold governance was handed over as a written joint deliverable rather than as tribal knowledge. Delivered in collaboration with Visionary Automate, a systems-integration partner of Zealous Digital Solutions.

05

Who this fits

This build suits a trucking or drayage operation running somewhere between 40 and 250 company drivers with telematics already installed, where management can feel a labour leak but cannot evidence it. Region does not matter. The engines read coordinates and timestamps, and the thresholds are set per site.

It is aimed at owners and operations directors in the United States who are already paying for GPS and getting almost nothing back from it. If your drivers are owner-operators paid per load rather than per hour, the labour half of the model does not apply and the detention half still does.

The build is a poor fit for fleets under about 20 trucks, where a dispatcher already knows every driver's day by memory and the software would cost more attention than it returns.

06

What the first 30 days look like

The first 30 days run as four stages, one a week, each ending with an artifact the carrier keeps.

• Week 1, discovery and data access. We take read access to the telematics feed, a list of every terminal, yard and customer site the fleet touches, and 90 days of history. You receive a written threshold map that names each site and the idle duration that counts as an exception there. • Week 2, build. The five engines are written against the live feed, the SQL evidence tables are created, and alert routing is wired into the dispatch chat channel already in use. You receive the running system in a test environment plus the evidence-trail schema, readable by your own analyst. • Week 3, supervised pilot. Engines run against a subset of drivers with alerts visible to dispatch only, never to drivers. You receive a false-positive log and a revised threshold map. Week 3 exists to correct numbers, not to prove the build works. • Week 4, cutover. Driver-facing alerts switch on, exception-only reporting begins, and the scorecard and dashboard go live. You receive a one-page runbook naming who is allowed to change a threshold, how the change is logged, and who reviews flags each week.

The order matters more than the speed. Skipping week 3 produces accurate alerts nobody trusts, because the first week of noise decides whether dispatch reads the feed or mutes it.

07

What you need in place before this works

Five things have to exist before the first engine can run. If any one is missing, the build stalls at data access rather than at development.

• GPS telematics on every tractor, with an API or a scheduled export. A vendor dashboard you can only look at is not enough, because the engines read raw coordinates and timestamps rather than reports. • At least 90 days of history in that feed. Thresholds are derived from your own sites, and 90 days is the minimum that separates a genuinely slow terminal from a slow week. • Geofences or coordinates for every terminal, yard and customer location you serve. Idle inside a known site and idle at an unknown location are different exceptions, and the difference is only computable if the sites are defined. • A named person who owns the escalation path. When an engine flags a driver, somebody has to be accountable for the conversation that follows. Without that name, alerts become a feed nobody reads. • Written agreement on what counts as an exception, cleared with operations and driver relations before go-live. A flag agreed in advance is a record. A flag agreed afterwards is an argument.

08

Questions buyers ask before committing

What happens when the system cannot classify a stop?

It escalates to a supervisor with the evidence attached, and it never acts on its own. The unknown-location engine is deliberately the noisiest of the five, because a stop matching no site on the run is the case a rule cannot settle. Those events arrive as questions, and the recurring ones usually end with a new geofence rather than a driver conversation.

Who owns the data and the telematics account?

You do, in every case. The telematics contract stays in the carrier's name, the SQL evidence tables sit in infrastructure the carrier controls, and the threshold configuration is a file you can read. The build never puts your operating history somewhere you cannot reach it.

What drives the ongoing running cost?

Three things: tracked vehicle count, alert volume, and evidence retention. Vehicle count sets the read load. Alert volume follows your thresholds, so a fleet that tunes aggressively carries more traffic. Retention is the factor most carriers underestimate, because an evidence trail that has to survive a labour dispute two years later is a different storage commitment from one kept for a quarter.

How is success measured in the first 90 days?

Against three numbers captured before cutover, not against a feeling. Hours of flagged idle per driver per day, hours a week spent reading GPS and camera footage by hand, and detention charges disputed without a timestamped record. The second and third move first, because they depend on the system rather than on driver behaviour.

09

Where this is the wrong fit

Some carriers should not buy this, and it is cheaper for everyone to say so now.

• Fleets under about 20 trucks, where a dispatcher already knows every driver's day and the software would cost more attention than it returns. • Operations with no named owner for escalations. A flag nobody is accountable for is a notification, and notifications with no consequence train people to ignore them. • Fleets running owner-operators paid per load. The detention half of the model still applies, but the labour recovery half, the larger number, does not. • Carriers whose telematics agreement does not permit programmatic access, or who have not settled driver notification obligations with their workforce.

If two or more of those describe your operation, the build will underperform its model, and we would rather say so first.

10

About this engagement

Delivered in collaboration with Visionary Automate, a systems-integration partner of Zealous Digital Solutions.

The client is not named here, and no city, terminal or customer is identified, at the client's request. The build described above is real and in production. The dollar figures are not. Every value in the ROI section is a modeled estimate derived from the carrier's stated pay rates, driver count and detention exposure, and from published third-party rate data where noted.

Actual results depend on the client's baseline and adoption. These figures are modeled estimates, not measured client results.

If your fleet carries a labour leak you can feel and cannot evidence, the next step is a conversation about your numbers rather than these. Bring your driver count, your telematics vendor and your detention exposure, and we will tell you honestly whether the same build would pay for itself in your operation.

Want Something Like This?

Every project starts with a conversation. Tell me the problem and I will show you the system that solves it, with the arithmetic behind it before you commit to anything.

In collaboration with Visionary Automate. Figures shown on this page are modeled estimates for a typical business of this profile, not measured client results.